Featured Titles
Rain Predicts GDP
Forecasting the cost of climate change is a big deal, for obvious reasons. But the economic models fast turn unwieldy. Health impacts, fires, floods, drought, mud slides, salt water in groundwater, crop loss, infrastructure costs, labour productivity, migration, ocean acidification, less food, more people, economic output, energy consumption… The impacts are endless and interrelated, folding back on themselves. For example, when it’s warmer a power plant needs more water to cool itself, to generate more power to use on its own cooling and… Brain explosion. The challenge with the models is quantifying multi-varied impacts on every industry, plus geopolitical impacts like immigration and conflict, the cost of decarbonisation, while forecasting population growth linked to health impacts and economic output and… you get the idea.
In 2006 the Stern Review had a run at it, and came up with a loss of 5%-but-maybe-20%-of-world-GDP. Stern said we could spend 1% of GDP if we acted fast and save 5%-but-maybe-20% in losses but that was 13 years ago so the numbers are now out of date. Along comes Nordhaus, punches some patchy old inputs that came from Richard Tol into his model, wins a Nobel Prize and says climate change will cost $134 trillion by 2100 or we can spend $20 trillion now to save $30 trillion later, then admits his model is probably broken in his user manual. Meanwhile, Burke and his pals have a brainwave. Instead of trying to figure out all the thousands of ways global warming will cost money, let’s just see if hot countries are poorer than cold countries. The UN likes Burke’s style and uses his method to forecast climate change will cost $33 trillion by 2050, or 10% of global GDP but if we act fast we can save $12 trillion.
It’s here, reading Burke’s model, that something feels missing. Climate change has big, non-linear impacts that transcend political maps. One of the largest is that 16 billion people in south east Asia rely on river flows fed by declining glacial melt water in the Himalayas. If the temperature changes in Nepal, then China and India suffer. With these two countries set to be the largest economies in the world by mid-century, a subsequent water deficit in these two nations will also have a material impact on global trade.
So how do you link the significance of water availability, rather than temperature, back to GDP? Attempting to answer this question, I came across a 2006 paper by Casey Brown and Upmanu Lall titled ‘Water and economic development: The role of variability and a framework for resilience’.
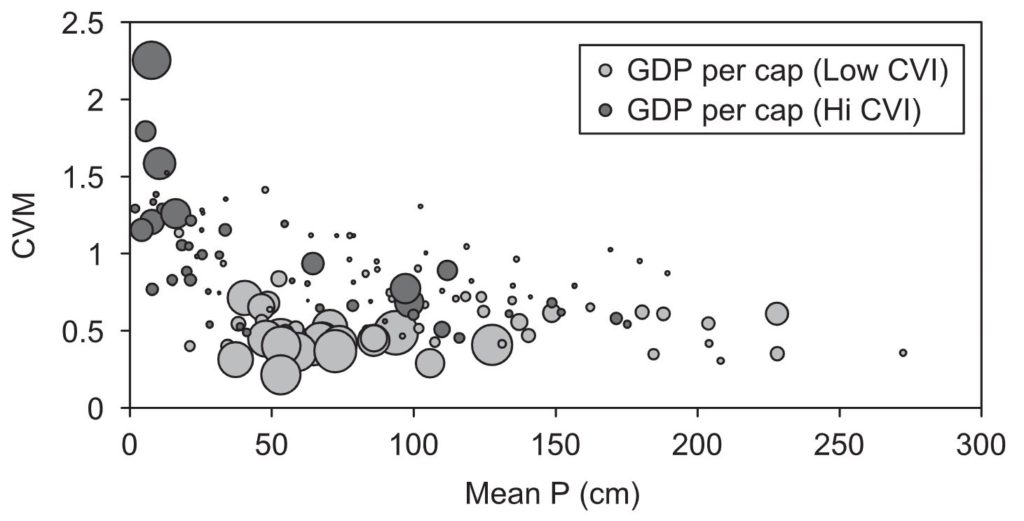
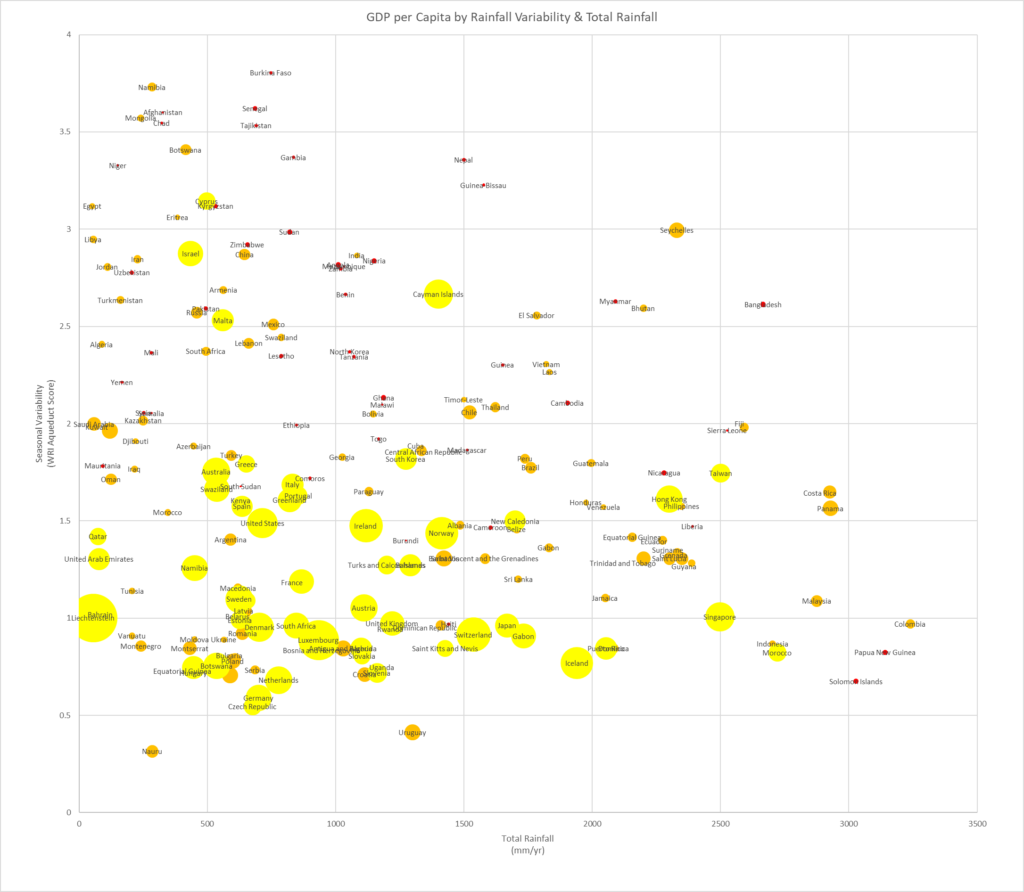
What is striking about this paper is the correlation (shown above) between GDP per capita and rainfall variability, or ‘CVM’. Not total precipitation. Variability.
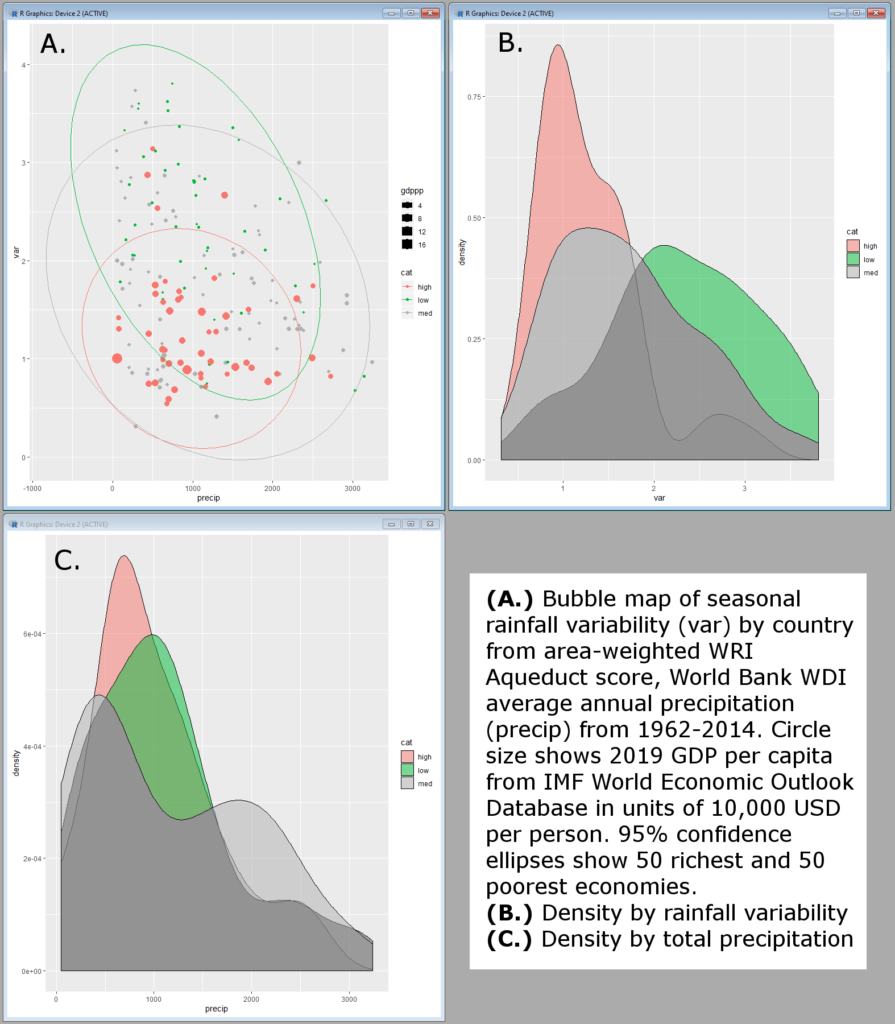
So I set out to reproduce Brown and Lall and made an unusual discovery. First, if you exclude resource rents from GDP (using World Bank data on coal, oil and gas exports) the correlation strengthens. These exports and in particular oil, skew GDP per capita significantly. Equally, if the goal is to model long-term sensitivity of economies to something like weather, fossil fuel exports add additional uncertainty to future decarbonisation scenarios. Here, where Brown and Lall had used monthly rainfall variability, I tried out WRI Aqueduct Water Risk Atlas 3-monthly, or seasonal, variability. The results are similar, but the outliers on the top-left side of the figure Brown/Lall figure above are now gone, and the role of total precipitation as a factor is even further diminished – and rainfall variability strengthened further.
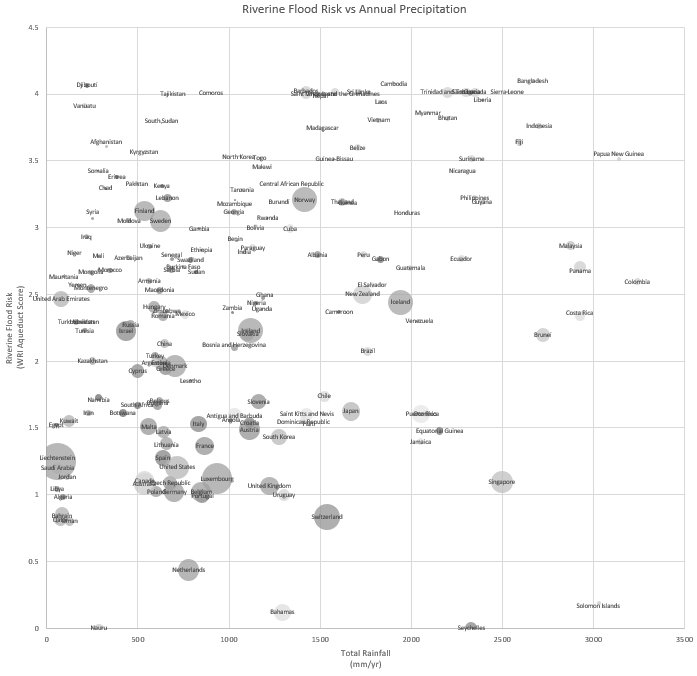
The striking thing about this result is that the rainfall variability isn’t about volatility, or even unpredictability, as 3-monthly season rainfall variability repeats every year. Rather, it’s the delta between seasons. The correlation seems inexplicable. And there aren’t very many studies looking at the impact of rainfall variability on economic activity. Lazo et al. 2011 found US GDP can move 3.4% in a year based on weather, but that limits economic impact to the normal range of conditions in North America. We can also exclude some initial conclusions about economic impacts of variable rainfall. It’s not about flood damage. Swap out rainfall variability for riverine flood risk rating by country, and the correlation decays:
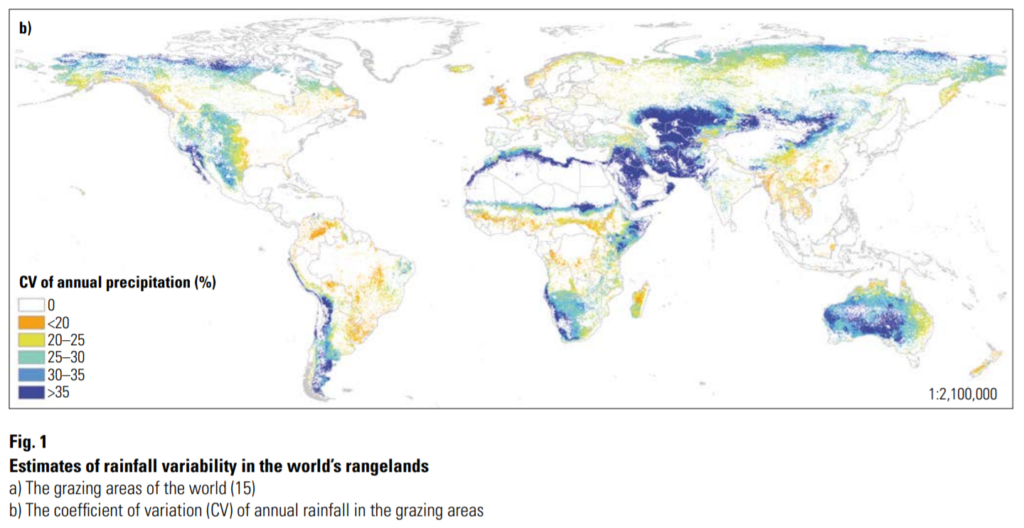
Another possibility is that rainfall variability just happens to correlate with others factor that drive GDP. Rainfall might be more variable in places where it’s colder. Or do these countries happen to be richer for some other reason? The problem with these theories is that while total precipitation varies fairly consistently by latitude, rainfall variability is based on a range of geographic features like topography.
Economies also derive water from rivers, glacial meltwater and aquifers. But as with total precipitation, the correlation between GDPs and water availability falls apart.
So what could it be about seasonal rainfall variability that bears so strongly on wealth?
Economic Impacts of Variable Rainfall
There are some obvious economic impacts of highly variable rainfall, and some not so obvious. Obviously drought, flooding and extreme storms all incur costs. But by themselves they aren’t enough to explain the global differences in wealth. So too, variable rainfall affects agriculture – especially grazing. Spatiotemporal rainfall variability also impacts tourism at a macroeconomic scale, and recreational and sporting events at a micro-economic level. Mining and construction – which both also consume water in their operations – stop operating completely in heavy rain, incurring significant costs. So too, port and airport operations and fishing. All these impacts combined go some way to answering the mystery. And then there is the less obvious:
· Infrastructure: In an economy with highly variable precipitation catchment and distribution systems, transport, energy and telecommunications systems all have to be engineered for a wider distribution of conditions, adding to design, construction, maintenance and operating costs. And not just water infrastructure. In particular, roads – both sealed and unsealed – are highly susceptible to fluctuations in subsoil and surface moisture. Rain also absorbs and scatters radio and radar signals. In some economies additional weather-proofing must be installed on radio towers during monsoon season. This may also lead to an indirect impact on productivity to impacts on air and sea navigation.
· Transport: In addition to the deteriorating effects on pavements, rain is the number one cause of road accidents, confirmed by multiple studies, e.g.: here, here and here. Rain causes road accidents through loss of visibility, tyre friction, spray from other vehicles, and cognitive strain. Variable rainfall likely also has an indirect impact on productivity of the transport industry.
· Property Damage: in addition to vehicle accidents, convective storms also cause hail damage – which is disproportionately expensive compared to other weather events. In the US, total damages from convective storms is the same as all hurricanes.
· Human Conflict: Numerous studies show the links between water availability and civil unrest, civil war, protests and riots, and political repression. But a 2015 study by scientists at Stanford, Berkeley and Cambridge also found a correlation between individual murders and rainfall deviation. Salehyan & Hendrix 2014, Von Uexkull 2014, Ghimire & Ferreira 2016, Mares & Moffetti 2016, and Burke et al. 2009 all find similar results on interpersonal conflict and violent crime.
· Other interactions: Extremes and deficits in rainfall contribute to other natural disasters not counted in flood damage, like fire season duration and severity. Soil erosion and drought also has an impact on land degradation with costs 17% of world GDP.
In addition to all of the above, there is an additional negative feedback in that many of the countries most impacted by weather, with the lowest GDP also suffer a disproportionate lack of meteorological services further compounding the uncertainty in their hydrological cycles.
If rainfall variability is such a strong predictor of wealth, this has serious implications for forecasting the impacts of climate change. But there is also a more philosophical lesson, if wealth is not entirely a product of political, social or behavioural differences between nations, to what extent are our living conditions simple geographic fortune?
It is with good reason that the world spends $50bn each year predicting where and when it will rain.
Categories: Featured.
Follow responses: RSS 2.0
Both comments and pings are currently closed.
Comments are closed.